In vivo Electrophysiology

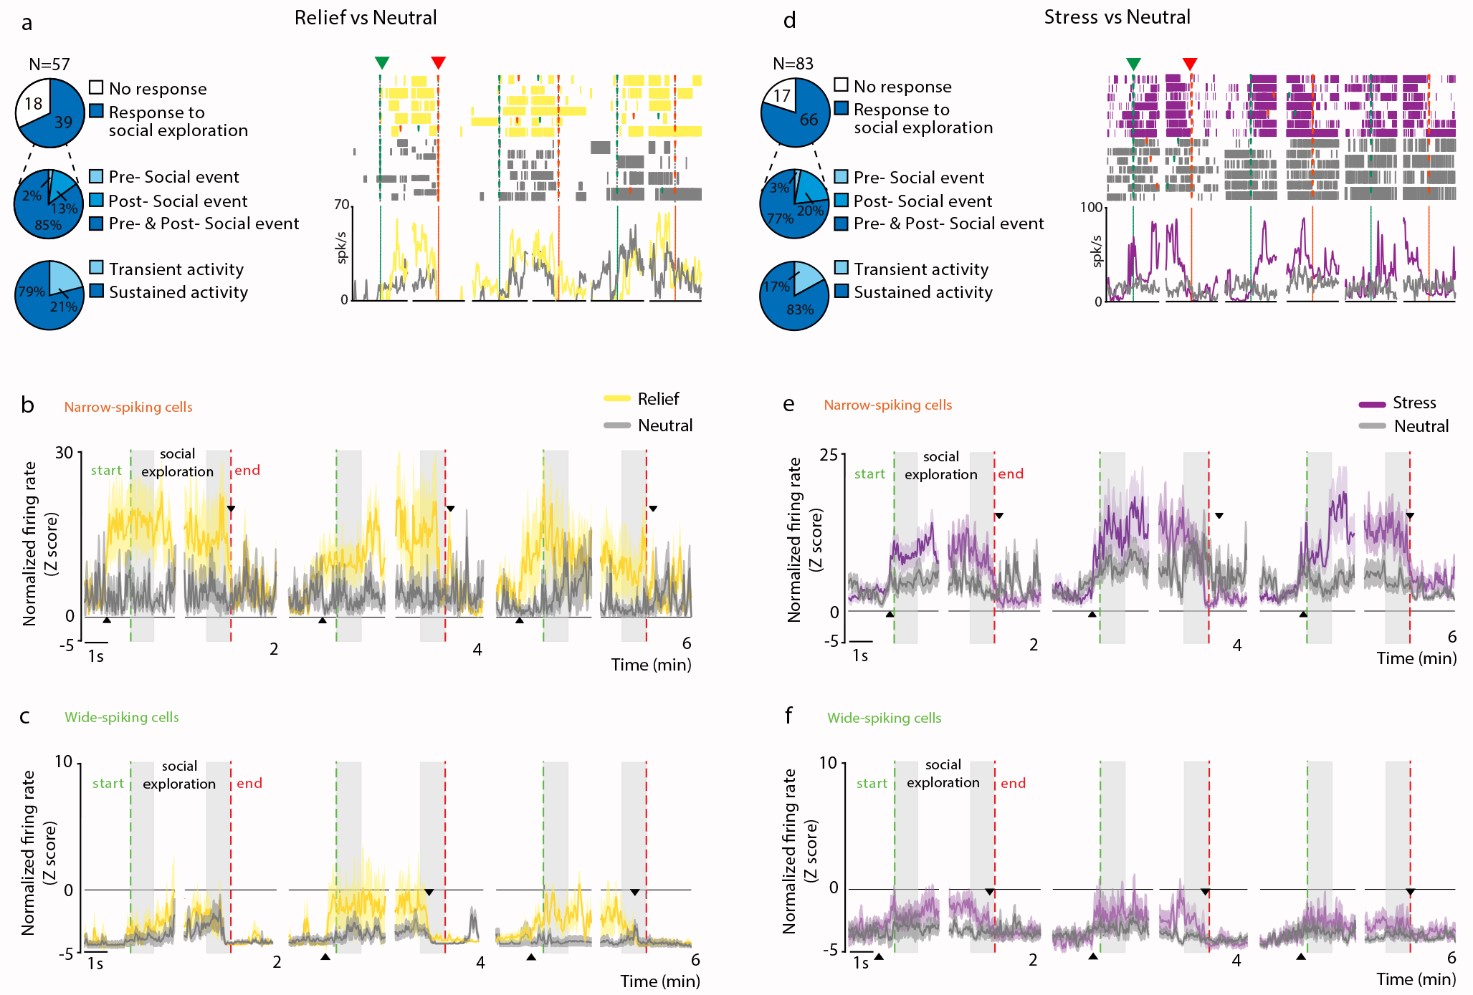
Enhanced neuronal activity in the mPFC during exploration of an emotionally-altered conspecifics. (a,d) Left, pie charts represent the number of responsive and non-responsive cells to social exploration; the percentage of responsive cells activating pre- and post-social event; and the percentage of the responsive cells displaying sustained or transient activity. Right, examples of a responsive cell recorded during the exploration of a relieved (yellow), stressed (purple) or neutral (gray) demonstrators. Rasters (Top) and polylines (bottom) aligned on the beginning (green dotted line) and end (red dotted line) of each exploration of the relieved, stressed or neutral demonstrators in the same session. (b,e) Population firing rate of narrow-spiking (NS) neurons show the increase of firing rate when starting to explore a relief or stress mouse. (c,f) Population firing rate of wide-spiking neurons (WS) showing less but still significant increase in firing rate when starting to explore a relief or stress mouse. Modified from Scheggia, Managò et al, Nature Neuroscience, In Press